From April 2025, UK restaurants absorbed a higher National Living Wage of £12.21 and an employer National Insurance rate of 15%, with a further wage rise to £12.71 landing in April 2026. When labour and food already swallow most of every pound taken, the operators who stay profitable are the ones who can see their costs move as they happen. The best reporting software for UK restaurants does exactly that: it tracks prime cost, food margin and labour percentage in real time across every site, so problems surface during the shift rather than three weeks later in the monthly accounts.
This guide sets out what that software should measure, the benchmark numbers to hold it against, and the features that separate a genuine reporting platform from a basic sales till. If you run a multi-site group and still reconcile margins in spreadsheets, the sections below explain what to change and why the timing matters now.
TL;DR: The best reporting software for UK restaurants tracks prime cost, which is food and drink cost plus labour cost as a percentage of sales, in real time and across every location. Aim to hold prime cost at or below roughly 60% of sales, with food cost around 28% to 35% and labour around 28% to 33% of turnover, and treat anything above 65% as a warning sign. Prioritise a tool that delivers a daily profit and loss view, live gross profit and labour tracking, stock reporting, multi-site comparison, and visibility of delivery revenue from Just Eat, Deliveroo and Uber Eats.
What should the best reporting software for UK restaurants track?
The number that decides whether a restaurant makes money is prime cost: the combined total of food and drink cost plus labour cost, shown as a percentage of sales. These are the two largest expenses on any restaurant profit and loss, and the two you can most directly control. The best reporting software treats prime cost as the headline figure and updates it from live sales and supplier data rather than leaving you to piece it together after the period closes.
Tracking prime cost matters more than watching food cost or labour cost on their own, because the two lines move against each other. Preparing dishes from raw ingredients lowers food cost but pushes labour up. Buying in pre-prepared stock does the reverse. Watch only one number and you can congratulate yourself on a low food cost while labour quietly eats the difference. Prime cost is the honest measure because it captures both at once.
The stakes are high because the margin underneath is thin. Net profit for UK restaurants typically sits between 3% and 9% of sales, with full-service venues at the lower end and quick-service operators nearer the top. When only a few pence of every pound reaches the bottom line, a food margin that drifts two points or a shift that runs long on labour is the difference between a profitable week and a loss. Reporting software earns its place by making that drift visible while you can still act on it.
Why does real-time cost tracking beat monthly reporting?
Month-end reporting is a post-mortem. By the time the accounts arrive, the shifts have been worked, the stock has been used and any overspend is already booked as a loss. You learn what went wrong long after the moment to fix it has passed. Real-time reporting changes the job from explaining last month to steering this shift.
The gap widens across multiple sites. A portfolio average flatters the group and hides the outlier, so one location running hot on labour disappears behind another running lean. Above-store managers often have no way to compare sites without logging into each system in turn or waiting for a report someone builds by hand. A live multi-site view puts every location side by side, so the site that needs attention stands out the same day.
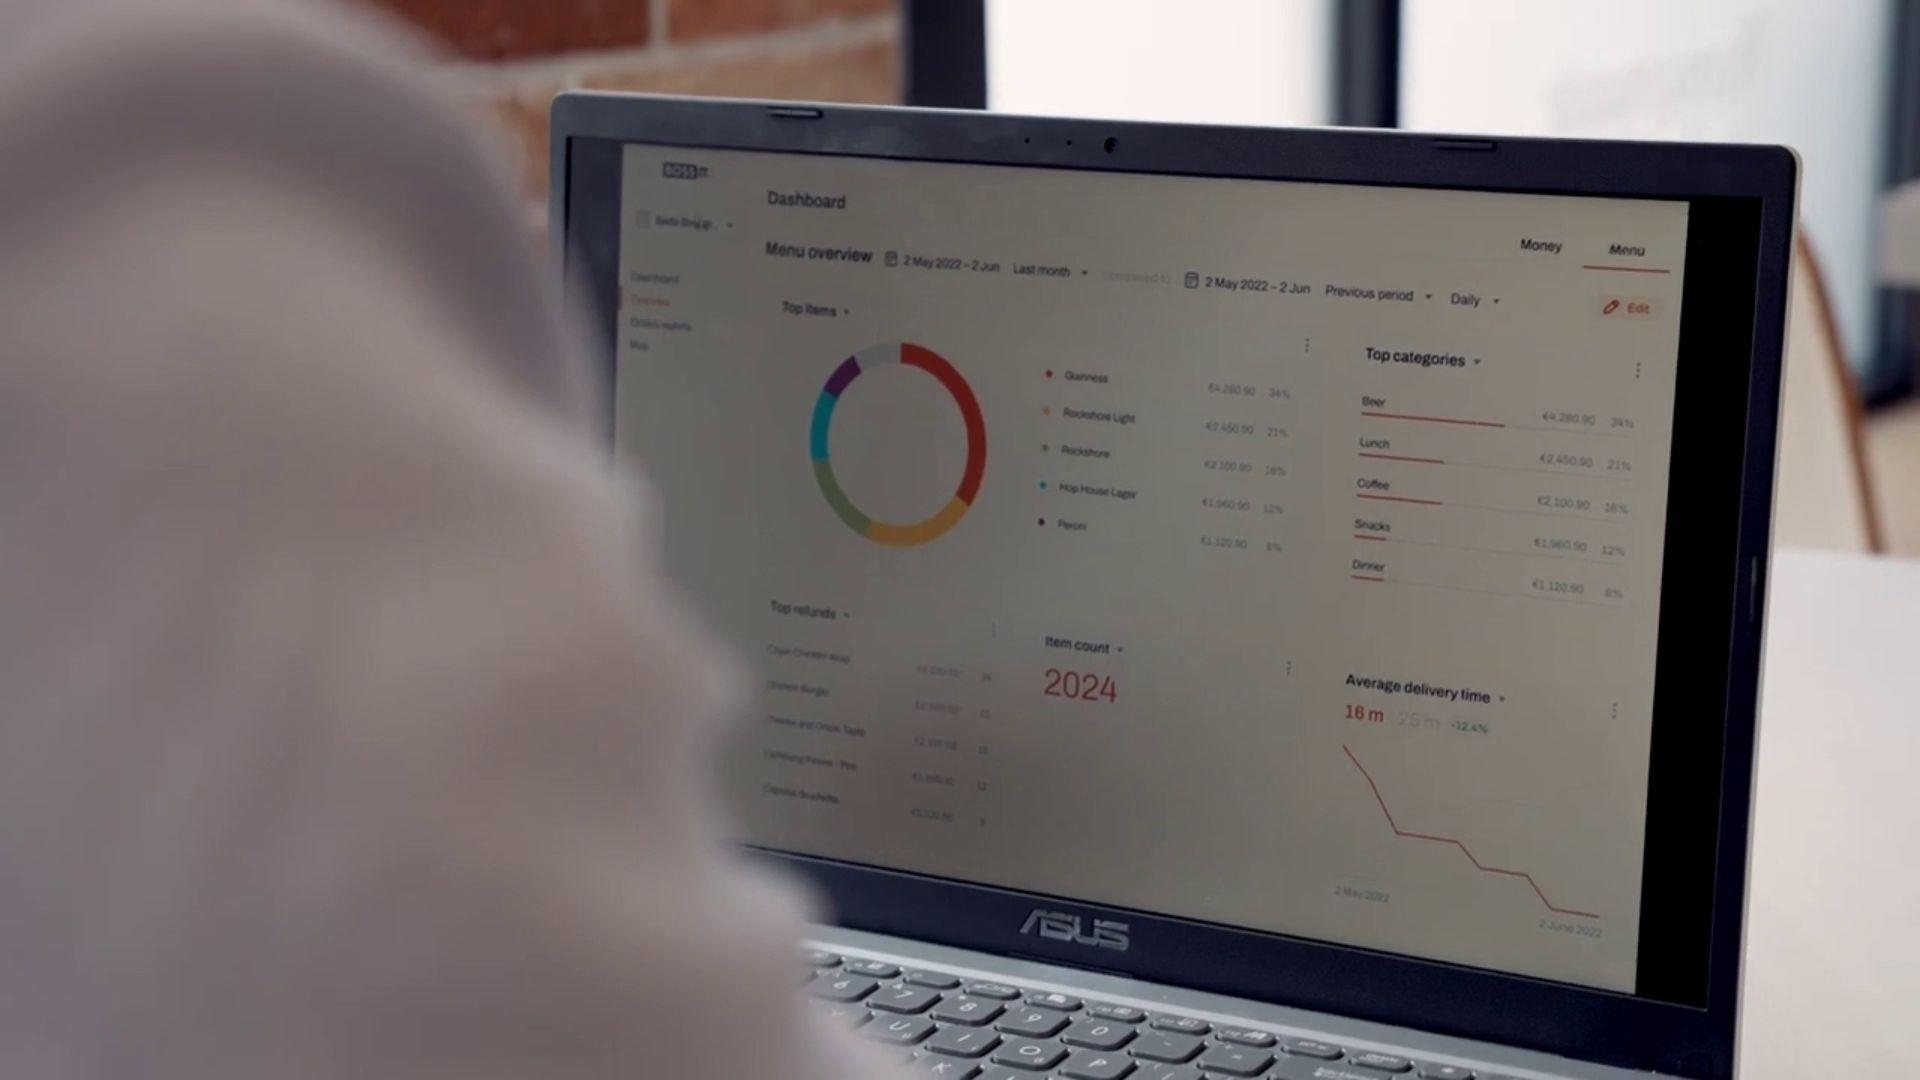
Manual spreadsheets carry a hidden cost of their own. Counting stock, checking prices and reconciling invoices by hand consumes hours every week, and rushed entry introduces the errors that quietly distort gross profit. Live software removes most of that work and replaces guesswork with figures you can trust. When a dashboard shows labour running above target mid-shift, a manager can adjust the rota before the cost is locked in, a saving that only exists because the data was current.
To see this in practice, watch how the multi-site takeaway group Romayo’s uses Boss It. In the video below, the team describes how the platform gave them financial reporting insight they did not have before, turning scattered numbers into a clear view of performance across their sites.
What are healthy prime cost, food margin and labour benchmarks for UK restaurants?
The widely used benchmark for prime cost is around 60% of sales. Hospitality software firm Fourth describes 60% as the generally accepted target and warns that once prime cost climbs to 65% and above, profitability starts to suffer. Restaurant365 gives the same figure, placing a healthy prime cost at roughly 60% of food and beverage sales, with full-service venues running slightly higher at 60% to 65%. Treat anything past 65% as a signal to act.
Food cost sits inside that total and varies by format. Across the industry the range runs from 28% to 35% of revenue, and the target that matters is the one for your concept rather than a generic average.
- Casual dining: typically 28% to 32%.
- Quick service and fast casual: tighter at around 25% to 32%, held down by portion control and volume.
- Pubs and gastropubs: higher at 30% to 38%, because high-margin drink sales subsidise the blend.
Labour is the other half of prime cost. The UKHospitality Christie and Co Benchmarking Report, the only UK benchmark built from operators’ actual profit and loss accounts, puts sector payroll at 28.3% of turnover, rising to 30.9% for casual dining and 32.6% for food-led venues. A working target of 28% to 33% of turnover is normal, with quick-service at the lower end and food-led restaurants at the top. Good reporting software lets you hold each site against the benchmark for its format, not a single number that suits none of them.
How are 2025 and 2026 cost pressures changing what restaurants need from reporting?
Wages and taxes are squeezing margins at once. The National Living Wage rose to £12.21 in April 2025 and to £12.71 from April 2026, according to gov.uk and the Low Pay Commission, and from 6 April 2025 employer National Insurance rose to 15% with the threshold cut to £5,000, which pulls lower-paid and part-time staff into the charge. UKHospitality estimated the combined effect added around £3 billion a year to the sector’s costs, including roughly £1.4 billion in wages.
Food prices add to the squeeze, with the Food and Drink Federation forecasting food inflation of 5.7% by the end of 2025. When wages, taxes and ingredient prices all rise against a net margin of a few percent, tracking labour and food monthly is no longer enough. Groups need to see the labour percentage against forecast before the shift ends and the food margin move as invoices arrive, because at these cost levels a slow reaction is an expensive one.
Which reporting features matter most for multi-site restaurant groups?
Once a group runs more than two or three sites, the features that protect margin are the ones that connect sales, stock, invoices and labour into a single live picture. Fragmented systems that each report in isolation are what create the month-end blind spots in the first place. Look for the following.
- Daily profit and loss: controllable profit updated every day from live sales and invoice data, not held back until the period closes.
- Live food margin tracking: gross profit and food cost percentage at dish level, with alerts when a supplier price change moves your margin.
- Labour percentage against forecast: labour cost as a share of sales per shift and per site, tied to a sales forecast so managers can adjust rotas in time.
- Stock and waste variance: theoretical against actual usage, so you can see exactly where margin leaks.
- Multi-site comparison: one dashboard that ranks every location on food cost, labour and sales, so the outlier is obvious.
- Aggregator revenue visibility: consolidated reporting of Just Eat, Deliveroo and Uber Eats, whose commissions of roughly 14% to 35% change the true margin on every delivery order.
The deciding factor is architecture, not brand. The question to ask any vendor is whether the software can pull POS sales, supplier invoices, stock and labour into one view across every site in real time. If it cannot, you are buying a sales report, not a reporting platform.
What are the best reporting software options for UK restaurants?
No single tool is best for every operator. The table below compares six restaurant analytics software platforms used by UK restaurants, judged against the criteria above: real-time visibility of food and labour cost, multi-site reporting, and how each one gets your data. The key decision is whether you want reporting built into your till, a dedicated cost-control layer sitting on top of it, or a native platform that does both.
| Software | Category | Real-time cost tracking | Multi-site reporting | Best suited to |
|---|---|---|---|---|
| Lightspeed | Cloud EPOS with analytics add-on | Sales, menu profitability and labour metrics via Advanced Insights, with food cost tracked through inventory tools | Yes, across locations | Full-service restaurants wanting reporting inside their till |
| Epos Now | Cloud EPOS, small-business focus | Real-time sales, stock and staff reports plus ingredient-level stock, lighter on automated prime cost | Yes, via Multi-Site Manager | Independents and small groups wanting an affordable all-in-one till |
| MarginEdge | Back-office cost control, sits on your POS | Daily profit and loss with food and labour cost and prime cost auto-calculated per site, fed by invoice and sales data | Yes, multi-unit view | Operators happy with their POS who want automated food-cost control |
| Fourth | Enterprise workforce and inventory suite | Labour analytics, recipe costing and purchase-to-pay linked to profit and loss, with dashboards uniting sales, labour and inventory | Yes, enterprise-grade | Large, complex estates with many sites |
| Nory | AI-native operating system | Live sales against forecast, plus food and labour cost managed against a prime-cost target with AI forecasting and ordering | Yes, multi-site profit-and-loss comparison | Multi-site groups focused on AI-driven profitability |
| Boss It | AI-native all-in-one platform, ordering to reporting | Live dashboard with profit and loss, cost management and stock reporting, plus AI stock forecasting, with clock-in wage data feeding the profit and loss | Yes, multi-location reporting and store comparison | Multi-site and franchise operators wanting ordering, operations and reporting in one system |
Lightspeed and Epos Now build reporting into the till itself. Lightspeed’s Advanced Insights add-on delivers strong sales, menu-profitability and labour analytics, though reviewers note the back office can feel heavy for a small operation. Epos Now is UK-founded and affordable, with real-time sales, stock and staff reporting and a Multi-Site Manager, but its automated food-cost and prime-cost depth is lighter and its contracts can run long. Both suit operators who want one system for tills and reporting rather than a separate platform.
MarginEdge, Fourth and Nory focus on the cost side and sit on top of your existing POS. MarginEdge automates invoice processing and produces a daily profit and loss with prime cost calculated per location, connecting to more than 60 POS systems, with the trade-off that you still run a separate till. Fourth is the enterprise incumbent, strongest for large estates needing deep labour analytics and purchase-to-pay tied to the profit and loss, and priced accordingly. Nory is the newest of the three, an AI-native platform that manages labour and cost of goods against a prime-cost target and reports figures of 10% to 20% lower labour cost and around 50% less waste, though those are the vendor’s own numbers rather than independently verified.
Where does Boss It fit? Unlike the cost-control tools that layer reporting onto a separate till, Boss It is a native all-in-one platform, so POS sales, stock, staff and delivery feed a single Operations Hub with profit and loss, breakdown, store-comparison, stock-level and staff-wage reports as standard. Its built-in channel manager pulls Just Eat, Deliveroo and Uber Eats revenue into the same reporting, and its royalty-split-at-source function is built for franchise groups, an area most of the platforms above do not cover. Boss It is also AI-native, with agentic AI that already runs stock forecasting and can take actions across the platform, and with AI staff scheduling and AI phone ordering both launching in Q3 2026. That makes it a fit for multi-site and franchise operators who want ordering, operations and reporting in one system instead of several stitched together.
How does better reporting cut food waste and protect margins?
Food waste is one of the clearest and most measurable margin leaks in hospitality. WRAP’s Guardians of Grub campaign reports that UK hospitality and food service throws away 1.1 million tonnes of food a year, 75% of it avoidable, costing the sector £3.2 billion, an average of about £10,000 per outlet. The return on fixing it is well evidenced: research by Champions 12.3 across 114 restaurants found a return of about 7 to 1 on money spent cutting kitchen waste over three years.
Stock reporting is what unlocks those savings, because you cannot reduce what you do not measure. Software that tracks theoretical against actual usage turns waste from an invisible cost into a line you can manage every week, often the fastest margin win available for a group already under pressure from wages and food inflation.
Key takeaways
The decision comes down to this. Choose reporting software that shows prime cost in real time and across every site, because at UK net margins of 3% to 9% you cannot afford to learn about overspend at month-end. Hold the group to sensible benchmarks: prime cost at or below 60%, food cost matched to your format, and labour near 28% to 33% of turnover, treating 65% prime cost as the line where you act. Given the 2025 and 2026 rises in wages, National Insurance and food prices, the operators who protect margin will be the ones who can see labour and food move during the shift, not the ones reading about it three weeks later.
Frequently asked questions
Most UK restaurants aim for 28% to 35% of revenue, with quick service nearer 25% to 32% and pubs higher at 30% to 38% because drink sales lift the margin. Match the target to your format.
A working range is 28% to 33% of turnover, per the UKHospitality Christie and Co Benchmarking Report, with quick service at the lower end and food-led venues at the top.
Yes. A capable platform consolidates aggregator sales alongside direct orders so you can see true margin after commission. Boss It brings delivery revenue into the same dashboard as in-house sales.
Basic EPOS reporting counts what you sold, what stock you hold and what hours staff worked. Dedicated cost-control tools such as MarginEdge, Fourth or Nory add a financial layer on top, pulling changing supplier invoice prices into your recipes to show gross profit and prime cost as a percentage of sales in real time. Boss It combines both in one native platform, so operational and margin reporting sit together.
Yes. Boss It is AI-native, with agentic AI that already runs stock forecasting and takes actions across the platform, such as pausing products or pulling sales data on request. AI staff scheduling and AI phone ordering are both launching in Q3 2026.
It tracks theoretical against actual stock usage so you can measure and cut waste, which WRAP identifies as a £3.2 billion problem for UK hospitality. Continuous measurement is what makes reduction possible.